The Bitcoin Dominance Chart is one of the most important tools used by crypto traders, investors, and analysts to understand the overall direction of the cryptocurrency market. While many people focus only on Bitcoin price movements, market dominance provides deeper insight into how capital flows between Bitcoin and altcoins.
In this detailed guide, we will explain what the Bitcoin Dominance Chart is, how it works, why it matters, and how you can use it to improve your crypto trading and investment decisions.
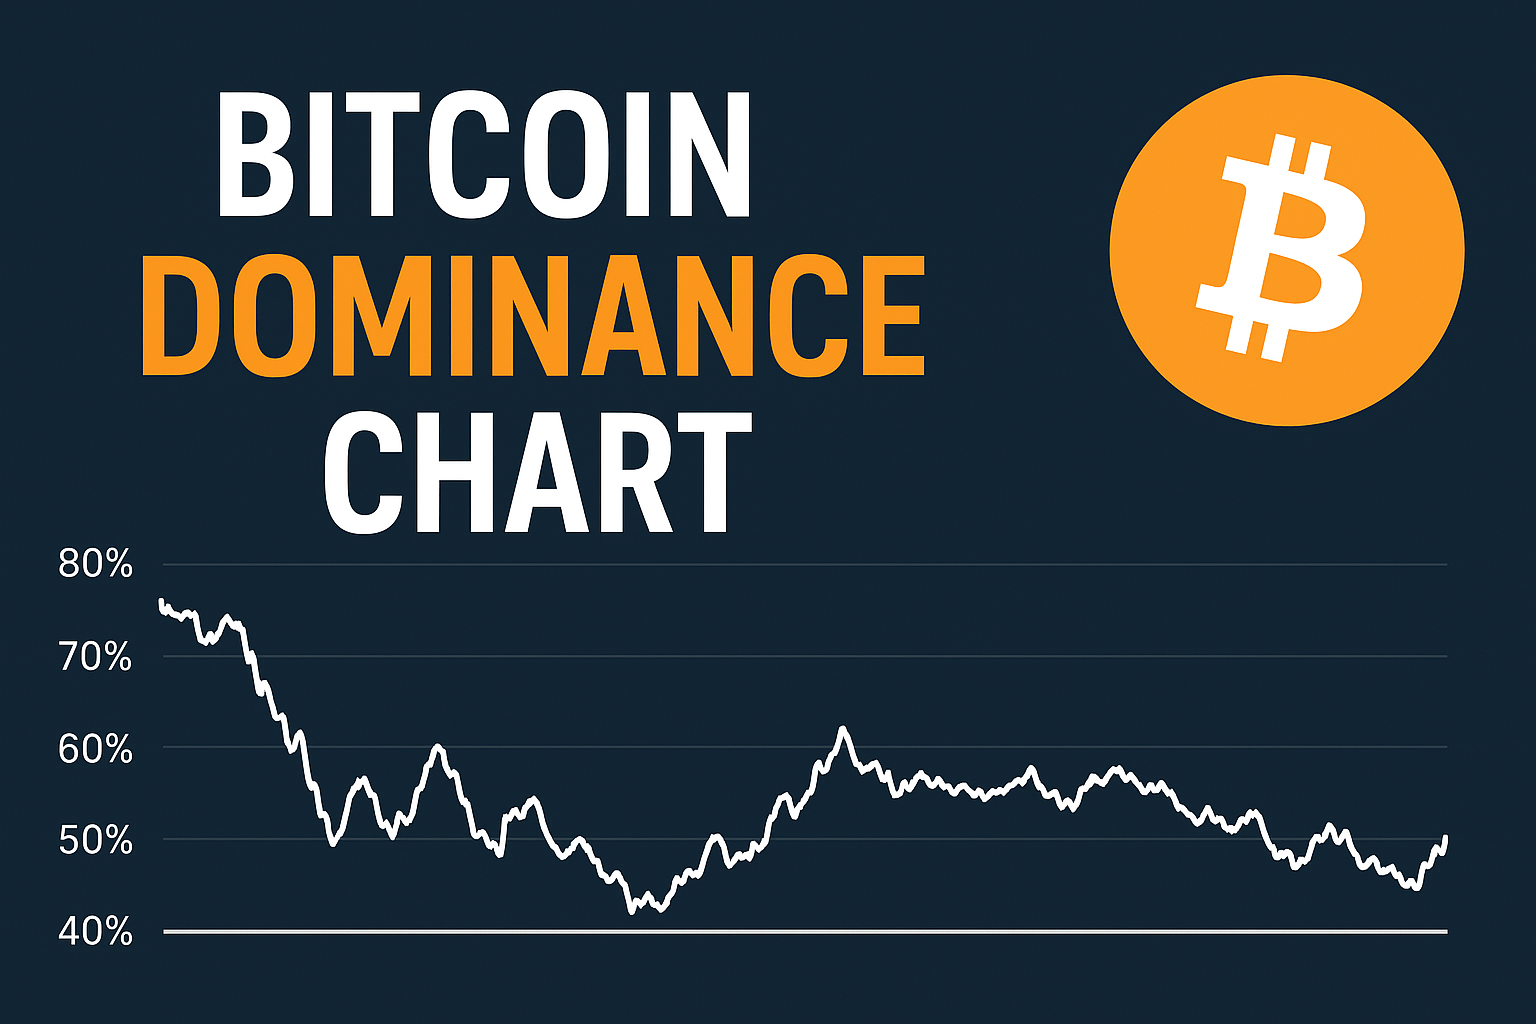
What Is the Bitcoin Dominance Chart?
The Bitcoin Dominance shows the percentage of Bitcoin’s market capitalization compared to the total market capitalization of all cryptocurrencieshttps://traficjet.com/ combined.
In simple terms, it answers this question:
How much control does Bitcoin have over the entire crypto market?
For example:
- If Bitcoin dominance is 50%, Bitcoin holds half of the total crypto market value.
- If dominance drops, it means money is flowing into altcoins.
You can track the Bitcoin Dominance on trusted platforms like:
- CoinMarketCap (https://coinmarketcap.com)
- TradingView (https://tradingview.com)
- CoinGecko (https://coingecko.com)
How the Bitcoin Dominance Chart Is Calculated
The formula behind the Bitcoin Dominance Chart is straightforward:
Bitcoin Market Cap ÷ Total Crypto Market Cap × 100
This calculation updates in real time as prices and market capitalizations change. Because of this, the Bitcoin Dominance Chart is a dynamic indicator that reflects current investor sentiment.
Why the Bitcoin Dominance Chart Is Important
Understanding the Bitcoin Dominance can give you a strong edge in the crypto market. Here’s why it matters:
1. Identifies Market Phases
- Rising dominance → Bitcoin-focused market
- Falling dominance → Altcoin season
2. Helps Manage Risk
When dominance is high, altcoins often underperform. When dominance falls, altcoins can offer higher returns but also higher risk.
3. Shows Capital Rotation
The Bitcoin Dominance Chart helps track when money moves from Bitcoin into altcoins and vice versa.
Bitcoin Dominance Chart and Altcoin Season
One of the most common uses of the Bitcoin Dominance is identifying altcoin season.
What Is Altcoin Season?
Altcoin season happens when most altcoins outperform Bitcoin over a specific period. Historically, this occurs when Bitcoin dominance drops sharply.
Signs of an upcoming altcoin season include:
- Falling Bitcoin dominance
- Bitcoin price moving sideways
- Increasing trading volume in altcoins
Many experienced traders monitor the Bitcoin Chart daily to spot these transitions early.
How Traders Use the Bitcoin Dominance Chart
1. Portfolio Allocation
Investors adjust their portfolios based on dominance levels:
- High dominance → More Bitcoin
- Low dominance → More altcoins
2. Entry and Exit Timing
A rising Bitcoin Dominance Chart may signal safer conditions for Bitcoin accumulation, while declining dominance can indicate opportunities in altcoins.
3. Market Confirmation
The Bitcoin Dominance Chart is often used alongside indicators like RSI, moving averages, and total market cap for confirmation.
Bitcoin Dominance Chart vs Bitcoin Price
Many beginners confuse Bitcoin price with Bitcoin dominance, but they are very different.
| Bitcoin Price | Bitcoin Dominance Chart |
|---|---|
| Shows BTC value | Shows BTC market share |
| Can rise alone | Can fall even if BTC rises |
| Short-term focus | Market-wide perspective |
It’s possible for Bitcoin price to increase while dominance decreases, which means altcoins are rising faster.
Historical Trends in the Bitcoin Dominance Chart
Historically, the Bitcoin Dominance has moved in cycles:
- 2017 Bull Run: Dominance fell sharply as altcoins exploded
- 2018 Bear Market: Dominance increased as investors moved back to Bitcoin
- 2021 Bull Market: Dominance dropped again during DeFi and NFT booms
- 2022–2023: Dominance rose due to market uncertainty
These cycles show how dominance reflects investor confidence and risk appetite.
Bitcoin Dominance in Bull vs Bear Markets
Bull Market Behavior
- Bitcoin dominance often rises early
- Later, dominance falls as altcoins outperform
Bear Market Behavior
- Dominance usually increases
- Investors seek safety in Bitcoin
Understanding this pattern helps traders align strategies with market conditions.
Best Platforms to Track the Bitcoin Dominance Chart
You can monitor the Bitcoin Dominance using reliable crypto tools such as:
- CoinMarketCap Dominance Metrics (https://coinmarketcap.com)
- TradingView BTC.D Indicator (https://tradingview.com)
- CoinGecko Market Data (https://coingecko.com)
These platforms provide historical data, technical analysis tools, and real-time updates.
Common Mistakes When Using the Bitcoin Dominance
Many traders misuse the Bitcoin Dominance Avoid these common mistakes:
- Relying on dominance alone without price analysis
- Ignoring stablecoins’ impact on total market cap
- Assuming dominance drops always mean instant altcoin gains
- Using short-term dominance changes for long-term decisions
The Bitcoin Dominance Chart works best when combined with other indicators.
Bitcoin Dominance Chart and Stablecoins
Stablecoins like USDT and USDC have a growing impact on the Bitcoin Dominance . When stablecoin market caps increase, Bitcoin dominance may fall even without altcoin growth.
This is why many analysts also track:
- BTC Dominance excluding stablecoins
- Total crypto market cap excluding BTC
Long-Term Outlook of the Bitcoin Dominance Chart
As the crypto market matures, Bitcoin is expected to remain the dominant asset. However, innovation in DeFi, NFTs, Layer-2 solutions, and AI-based blockchains may continue to challenge Bitcoin’s dominance.
Long term, the Bitcoin Dominance will remain a key indicator for understanding market structure and investor behavior.
Conclusion
The Bitcoin Dominance Chart is more than just a percentage figure. It is a powerful indicator that reveals how money flows through the crypto market. Whether you are a beginner or an experienced trader, understanding and tracking the Bitcoin Dominance Chart can help you make smarter investment decisions.
By combining dominance analysis with price action, volume, and market trends, you gain a clearer picture of when to focus on Bitcoin and when to explore altcoin opportunities.